
Full list
VRML Interactive Tutorial
Introduction
VRML File Structure
Drawing: Shape node
Geometry Nodes:
|
Box
Sphere Cone Cylinder PointSet IndexedLineSet IndexedFaceSet Extrusion ElevationGrid Example: Chessboard Text FontStyle |
| Material
Textures
Texture Transform |
|
Directional Light
Point Light Spot Light |
Hierarchical Node Structures
|
Group
Transform Collision Anchor Billboard Switch |
Defining and Instancing Nodes
Defining Levels of Detail
Events in VRML
|
Creating Paths between events:
ROUTE
Generating Events based on Timers or User Actions
|
|
Color
Coordinate Normal Orientation Position Scalar Example |
|
Sound
AudioClip |
|
Who Am I: NavigationInfo
Where Am I: ViewPoint |
|
Background
Fog |
| WorldInfo |
|
Coordinate
Color Normal |
Interpolators
Interpolators define a Dictionary from a key, ranging from 0.0 to 1.0, to a keyValue, which can take several types of data depending on the Interpolator. All fields and events are equal for all Interpolators, only the data type varies.
In VRML the following interpolators are available:
Interpolators have an eventIn, see events, set_fraction , and an eventOut value_changed. These two events are wired together, i.e. when the node receives a set_fraction event it generates a value_changed event.
The set_fraction event specifies a key value, the value_changed event outputs the data, specified in keyValue which corresponds to the key value given.
Interpolators combined with TimeSensors can be used to create animations, color variations, morphing objects, etc.... In each of the interpolator nodes, listed at the beggining of this section, an example will be provided.
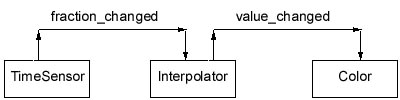
One of the events generated by the TimeSensor node is the fraction_changed event. This event can be linked to the set_fraction event from the interpolator using a ROUTE. The interpolator will in turn generate the event value_changed. This event can then be routed to an exposed field of another node, for instance the color field of the Color node. The end result of this series of ROUTES is that the color of a given shape will change over time. The following figure shows the chaining of events between the nodes (read the figure from left to right):
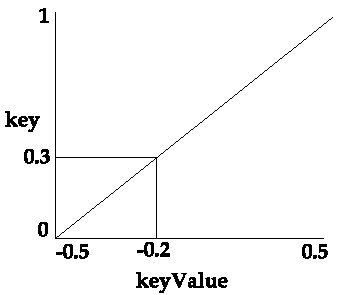
In the remaining of this section a short disscussion of the fields present in all interpolators, key and keyValue, is presented. For instance consider that the following values for key and keyValue are given:
If the set_fraction event inputs 0 then the value_changed event outputs -0.5. Similarly when the set_fraction event inputs 1 then the value_changed event outputs 0.5.
So what happens when the set_fraction event inputs 0.3? Well, it is time to look at the title of this section. The nodes being dealt with in here are interpolators, so when 0.3 is inputed, the output will be -0.2, i.e. the value which would correspond to the key 0.3 if all possible pairs ( key, keyValue) were specified and assuming that the pairs mentioned correspond to a straight line. The following figure shows how the keyValue for key 0.3 was computed.
The above example is a very simple one, you just specify two values for the key and the interpolator node does the rest.
This is OK if you want to specify a linear relation between key and keyValue. However there are situations when the desired relation is not linear.
You can specify as many elements as desired in the key and keyValue lists, note however that the lists must have the same length.
For instance consider that the following values for key and keyValue are given:
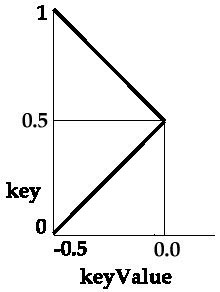
By using a larger number of points you can approximate a curve.